BMJ say:
Evidence of the UK’s higher overall death toll during the first wave of the pandemic relative to comparable countries is unequivocal. England had the highest excess all-cause mortality rate among 23 European countries in the first five months of 2020 compared with 2015-19, followed by Spain and Scotland, with mortality being spread throughout the country in contrast to the more localised patterns in Europe.2 England also had the second (after Spain) highest peak of excess all-cause mortality and the slowest fall to normal levels—so the longest period of excess deaths. The contrasts with Norway, Finland, Denmark, Austria, and some eastern European countries, where no excess mortality was observed throughout 2020, are even sharper.
Recent changes to the definition of a covid-19 death in England (from all deaths after a positive test to deaths within 28 days) have reduced the UK’s official covid-19 death toll by 16%.13 But the change doesn’t alter the UK’s poor ranking among European peers. Excess mortality rates based on death certification data2 are more reliable for national and international comparisons than the covid-19 “surveillance” data used for tracking the pandemic’s trajectory.4 Comparisons of excess mortality circumvent differences in how covid-19 deaths are counted and also include deaths from the wider effects of the pandemic.
So where are we now and how did we get here? The overall death rate for England from 1 January to 31 July 2020 was the highest since 2009 (less consistently true also of Wales).5 The year got off to a good start, with a mild influenza season and almost 5000 fewer deaths in England and Wales up to early March 2020 than the 2015-19 average. But in the ensuing five months, there were over 58 000 more deaths than the 2015-19 average, of which almost 52 000 (89%) were related to covid-19.1
Total deaths returned to near normal levels some weeks ago, as they did in other European countries, after which they fell below normal. In the eight weeks to 7 August there were about 1700 (2%) fewer all cause deaths in England and Wales than the 2015-19 average. This welcome respite has a darker side, however, as it suggests many of the earlier deaths had been premature, for which ONS analyses provide further corroboration. It’s unclear whether the increase in deaths in the fortnight to 21 August to above average levels is related to a heatwave or signals a longer term trend.
PHE say:

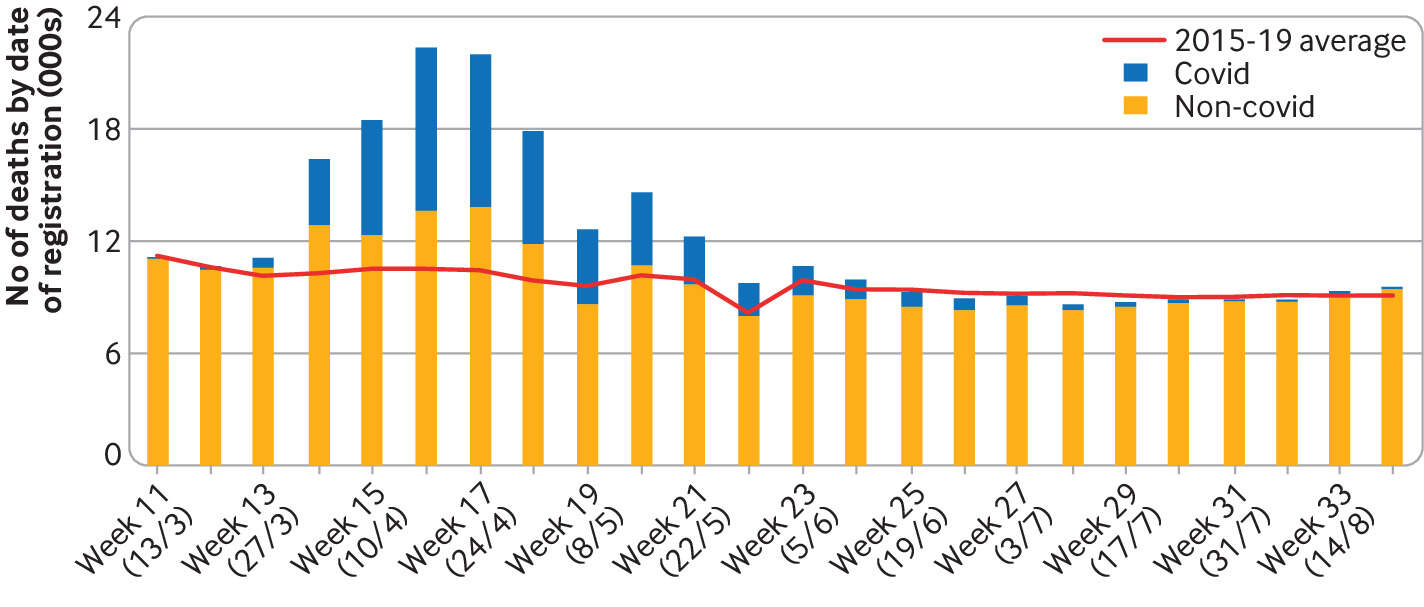
Weekly excess deaths by date of registration, England.
The trend in total excess deaths by week, in England, since week ending 27 March 2020 is shown in Figure 1. Numbers above each of the columns show the total number of excess deaths and how these compare with the expected number based on modelled estimates for 2015 to 2019. For example, in week ending 24 April there were 10,039 excess deaths and this was almost double (1.96 times higher) the expected number of deaths in this week. When fewer deaths than expected occur in a week, the column is coloured grey.
Excess deaths where COVID-19 was mentioned on the death certificate are shown in orange. If the number of deaths is not shown in the orange part of the column, that means the total excess was less than the number of deaths with a mention of COVID-19, indicating fewer deaths from other causes than expected in these weeks.
The number of excess deaths without COVID-19 mentioned on the certificate (shown in the white part of the column) may be due to an increase in deaths from other causes during the period of the pandemic but may also reflect under-reporting of deaths involving COVID-19.