Then that should be explained. It would also be helpful if you could show how much the changing of the reporting method would have changed the numbers.
The case counts are coming down in many places in the world, whether the method of counting has changed or not. If these particular numbers are in question, there should be some level of confidence in the numbers given.
How many case numbers (if any) would be added if the change in reporting was not made? If you’re saying that the numbers lack accuracy, you must be claiming that there were some. What’s your claim in numbers about this?
So, a drop in recent reported case numbers may be due to people pre-empting the “rule” change. The drop maybe further inflated by the policy implementation.
In the future, this will mean that the ONS Survey’s figures will be providing a more accurate estimate of COVID-postive numbers.
You’re putting the assessment on the trend, so it is you who is questioning.
From the article:
How many? If the number is in the double digits even up to a couple hundred, that doesn’t affect the trend line. In order for the amount to affect the trend line, the number would have to be in the thousands.
Do these confirmatory tests ever get double counted as two cases? If so, could the number of cases be inflated by the practice and now be more indicative of the actual number? How could you know for sure?
lol so do I. But in the absence of any other more credible source, it’s biasing the data to make a negative assessment on only one side of the data. . .when it’s going down and not when it’s going up.
I think what Butterscotch meant is that you only trust the data when the case number is rising and you question the data when the case numbers are falling. Is that right @butterscotch ?
The thing about large datasets of numbers, particularly when there are a number of places reporting is that it can always be questioned. So unless there’s some actual and verifiable discrepancy, questioning the numbers just adds uncertainty. Pointing out the questions at one time over another without verifiable numbers doesn’t add anything to the data.
I don’t trust the data when BJ changes the method of collection and there’s a dramatic change in direction.
ONS, AFAIK, have maintained their method of data collection, correlation and calculation throughout the pandemic. Their weekly report should provide an interesting comparison to the “official” figures.
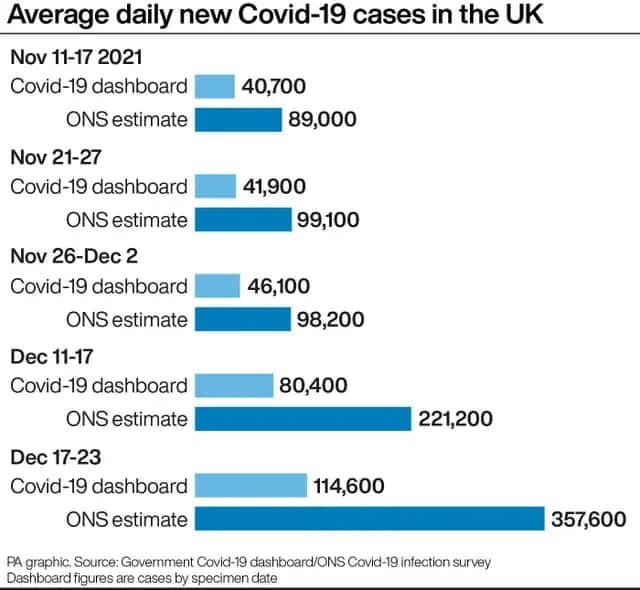
An average of 114,600 new cases were recorded each day in the week to December 23, according to the Government’s Covid-19 dashboard.
But the true figure might have been more than three times that number, according to new estimates published by the Office for National Statistics (ONS).
It means more than one and a half million new cases of coronavirus could have been missed from the official figures in the week before Christmas.
The huge difference in totals shows just how many new cases of Covid-19 are likely being missed in the Government’s daily figures, which count only those people who have reported themselves as having tested positive for the virus.
This means the figures are affected by factors such as how many people are coming forward for tests, have chosen to report their test results, or who are taking a test because they know they have coronavirus symptoms.
High levels of underreporting will still be affecting the Government’s daily figures, meaning the current volume of cases in the UK is unclear.
If that “trend” continued over Xmas and the New Year then the difference could be staggering.
With the recent procedural changes, any “discrepancy” will be exaggerated.
The UK has reported another 81,713 coronavirus cases, the lowest daily level seen since 15 December.
The apparent ebbing of the Omicron wave comes as some experts claim the end of the pandemic is in sight for the UK.
However, the number of deaths within 28 days of a test remains high, with 1,843 over the past seven days - a 45% rise from the previous week.
The number of hospital patients with Covid has dropped - though the most recent figures date from Monday.
The 15,698 admitted in the seven days to 10 January represented a slight week-on-week fall.
Daily reported cases and deaths are often lower at the weekend, but the trend for reported infections has been falling steadily since the new year.
However, confirmed cases are still significantly higher than the peak of previous waves of infection during the pandemic, following the arrival in November of the highly transmissible Omicron variant.
Yes. You can actually check some trends by looking at the title changes. Last I checked, it had changed 33 times since the start. To see the changes, hit the orange pencil in the first post to scroll back and see the changes. The OP is making those changes manually.
Edit: To get to the first post quickly, click on the title of the thread. That will take you to the top of the thread.